Collect
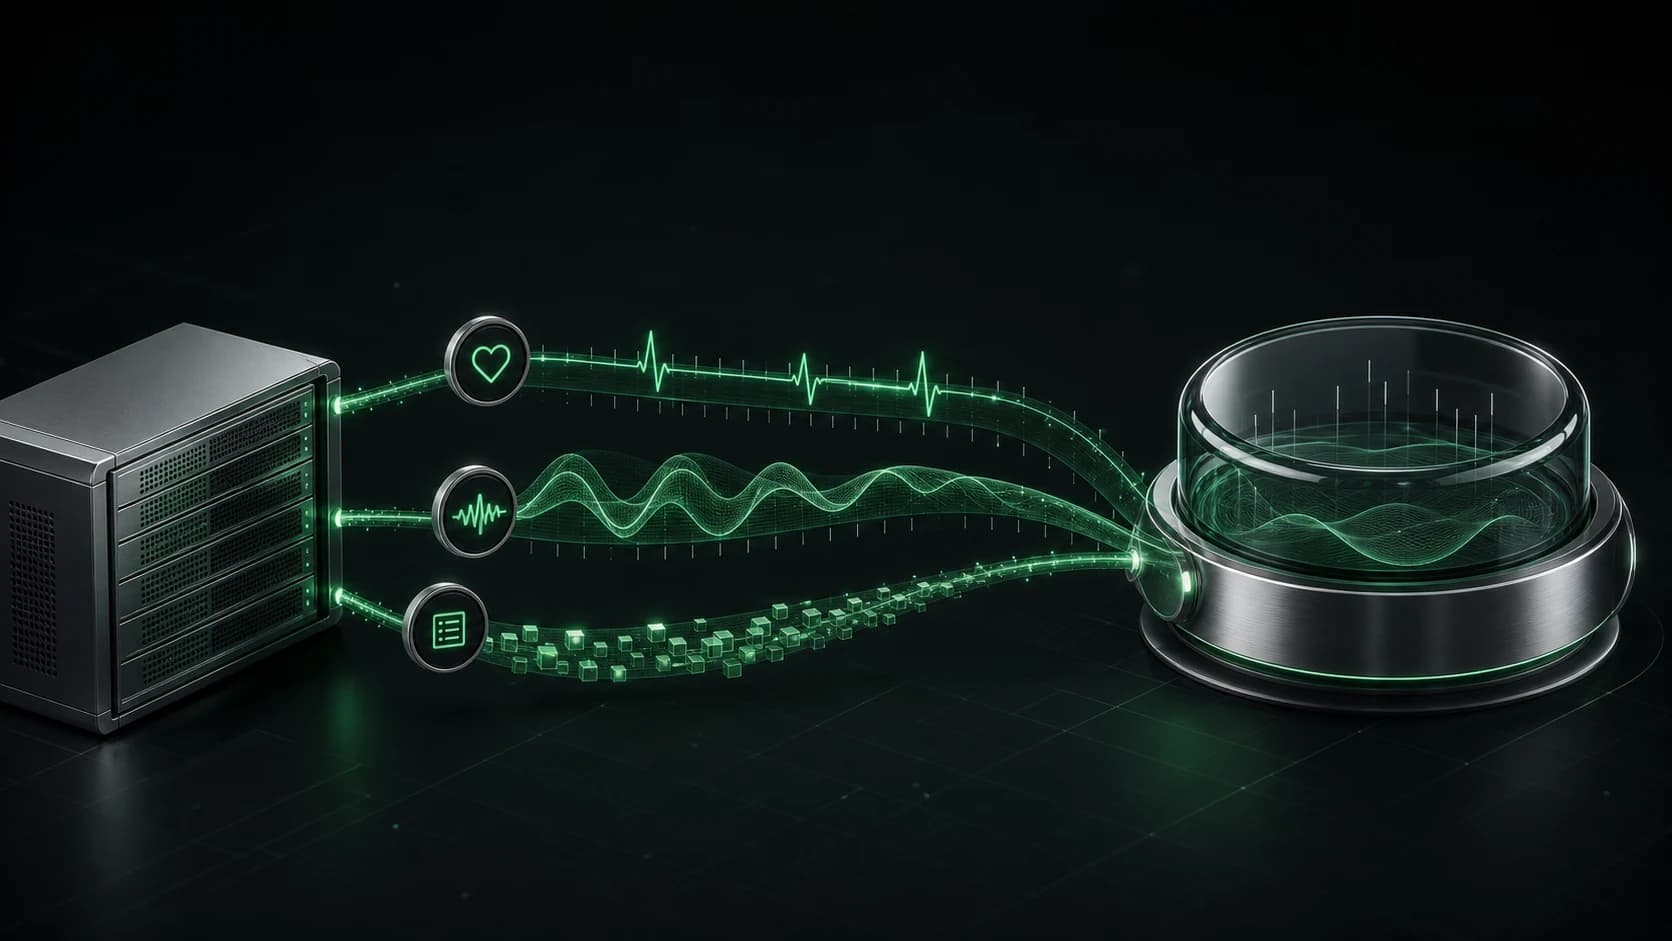
The connected agent reports operational state and metrics.
Bring deployment logs, application health, infrastructure metrics, and operational alerts into a single control plane built around action.

 Atmospheric product illustration
Browser-only · no external system is contacted
Illustrative current state
The workflow
The connected agent reports operational state and metrics.
Opslin organizes signals by server, app, and deployment.
Configured conditions surface through supported notification channels.
Open the affected resource with the surrounding context intact.
See online, degraded, and failed states with clear labels.
Connect events with the deployment or infrastructure change that caused them.
Review logs and activity without switching between disconnected tools.